PEP 6305 Measurement in
Health & Physical Education
Topic 5: The
Normal Distribution
Section 5.1
n
This Topic has 4 Sections.
Reading
n
Vincent & Weir, Statistics in Kinesiology 4th ed., Chapter
6 “The Normal Curve” and Chapter 7 "Fundamentals of Statistical Inference"
Purpose
n
To demonstrate the properties of the normal distribution,
including the relations among percentiles, central tendency, and variability.
n
To demonstrate the application of the normal distribution in
problems of scoring, sampling, and hypothesis testing.
Standard Scores
n
Comparing variables that are not measured in the same units and
have different means and variability is difficult.
¨
For example, how would you compare someone's performance in the long jump to
someone else's performance in a 1 mile run to evaluate who is the "better"
athlete?
n
Standard scores have a known mean and variability.
Converting raw, observed scores to standard scores aids in comparisons.
n
There are four standard scores discussed in the text: Z scores,
percentiles, T scores, and stanines.
Z
Scores
n
As we saw in the
previous topic, the standard deviation (SD) has a
specific relation to the normal distribution.
¨
The normal distribution is the distribution that many
common and important variables follow.
n
A Z score converts a raw score into the number of standard
deviations that the score lies from the mean of the distribution.
n
A Z score is calculated by subtracting the mean
( ) from the score
(X) and
dividing the difference by the SD:
) from the score
(X) and
dividing the difference by the SD:

n
So, for example, if the mean is 175 and the SD is 25, a score of
200 has a Z score of 1.0.

¨
What is the Z score for scores of 250, 125, and 133 in this
distribution? (Answers)
¨
What is the Z score for a score of 175? (Answer)
n
The mean of a distribution of Z scores is always 0 with an SD of 1.0. Thus, Z
scores are normalized to the SD of the original variable.
 n
When the Z score is known and the distribution of scores is
normal, the percentage of the population’s scores that are between the mean and
the Z score is also known because of the relation between the normal
distribution and percentiles.
n
When the Z score is known and the distribution of scores is
normal, the percentage of the population’s scores that are between the mean and
the Z score is also known because of the relation between the normal
distribution and percentiles.
n
In a normal distribution,
approximately 34% of the scores are between the
mean and +1 SD; an additional 34% of the scores are between the mean and –1
SD. So, in a normal distribution about 68% of the population (a little more than
2/3) will have scores
are within 1 SD of the mean.
¨
This means that a Z score of -1 corresponds to the 16th
percentile; a Z score of 1 is the 84th percentile.
¨
95% of the scores are between ±2 SD.
¨
99.7% of the scores are between ±3 SD.
¨
Table A.1 in the textbook (Appendix A) provides the percent of scores between any given Z score
and the mean.
n
You can compute the percentile for
a Z score using the Table's percentage values.
¨
Using Table A.1, find the value for your Z score.
¨
If your Z score is negative, subtract the value in Table A.1 from
0.50. This is because a negative Z score indicates a score below the mean
(why?). Recall that, if the scores are normally distributed, 50% of the scores
lie at or below the mean. So if a score is below the mean, you have to
subtract the value in Table A.1 (the percent of scores between the mean and –Z)
from 0.50 to get the percentile for that Z score.
¨
If your Z score is positive add 0.50 to the value in Table A.1.
This is because a positive Z score indicates a score above the mean
(why?). Recall that, if the scores are normally distributed, 50% of the scores
lie at or below the mean. So if a score is above the mean, you have to
add 0.50 to the value in Table A.1 (the percent of scores between the mean and
–Z) to get the percentile for that Z score.
n
You can also get the percentiles using Excel (click here).
Percentiles
n
Percentiles were discussed in
Topic 3.
n
The percentile of a score tells you what proportion of the population
received that score or lower.
n
The
central tendency of percentiles is 50% and the range is 0% to
100%.
n
Percentiles allow categorizing scores into
quartiles and deciles,
which can be useful for identifying groups of people who are similar.
n
The scores do not have to follow any particular
distribution (e.g., can be normal,
skewed, kurtotic, etc.).
T
Scores
n
A T score is similar to a Z score, except that the mean is always
50 and the SD is always 10. This is accomplished by changing the Z
score's scale (unit).
n
To find the T score, compute the Z score and then multiply Z by 10
and add 50:

n
So, using the example above where the mean is 175 and the SD is
25, a score of 200 has a T score of 60.
and
then,

¨
What is the T score for scores of 250, 125, and 133? (Answers)
¨
What is the T score for a score of 175? (Answer)
n
This Figure compares percentiles, Z scores,
and T scores for a normal distribution:
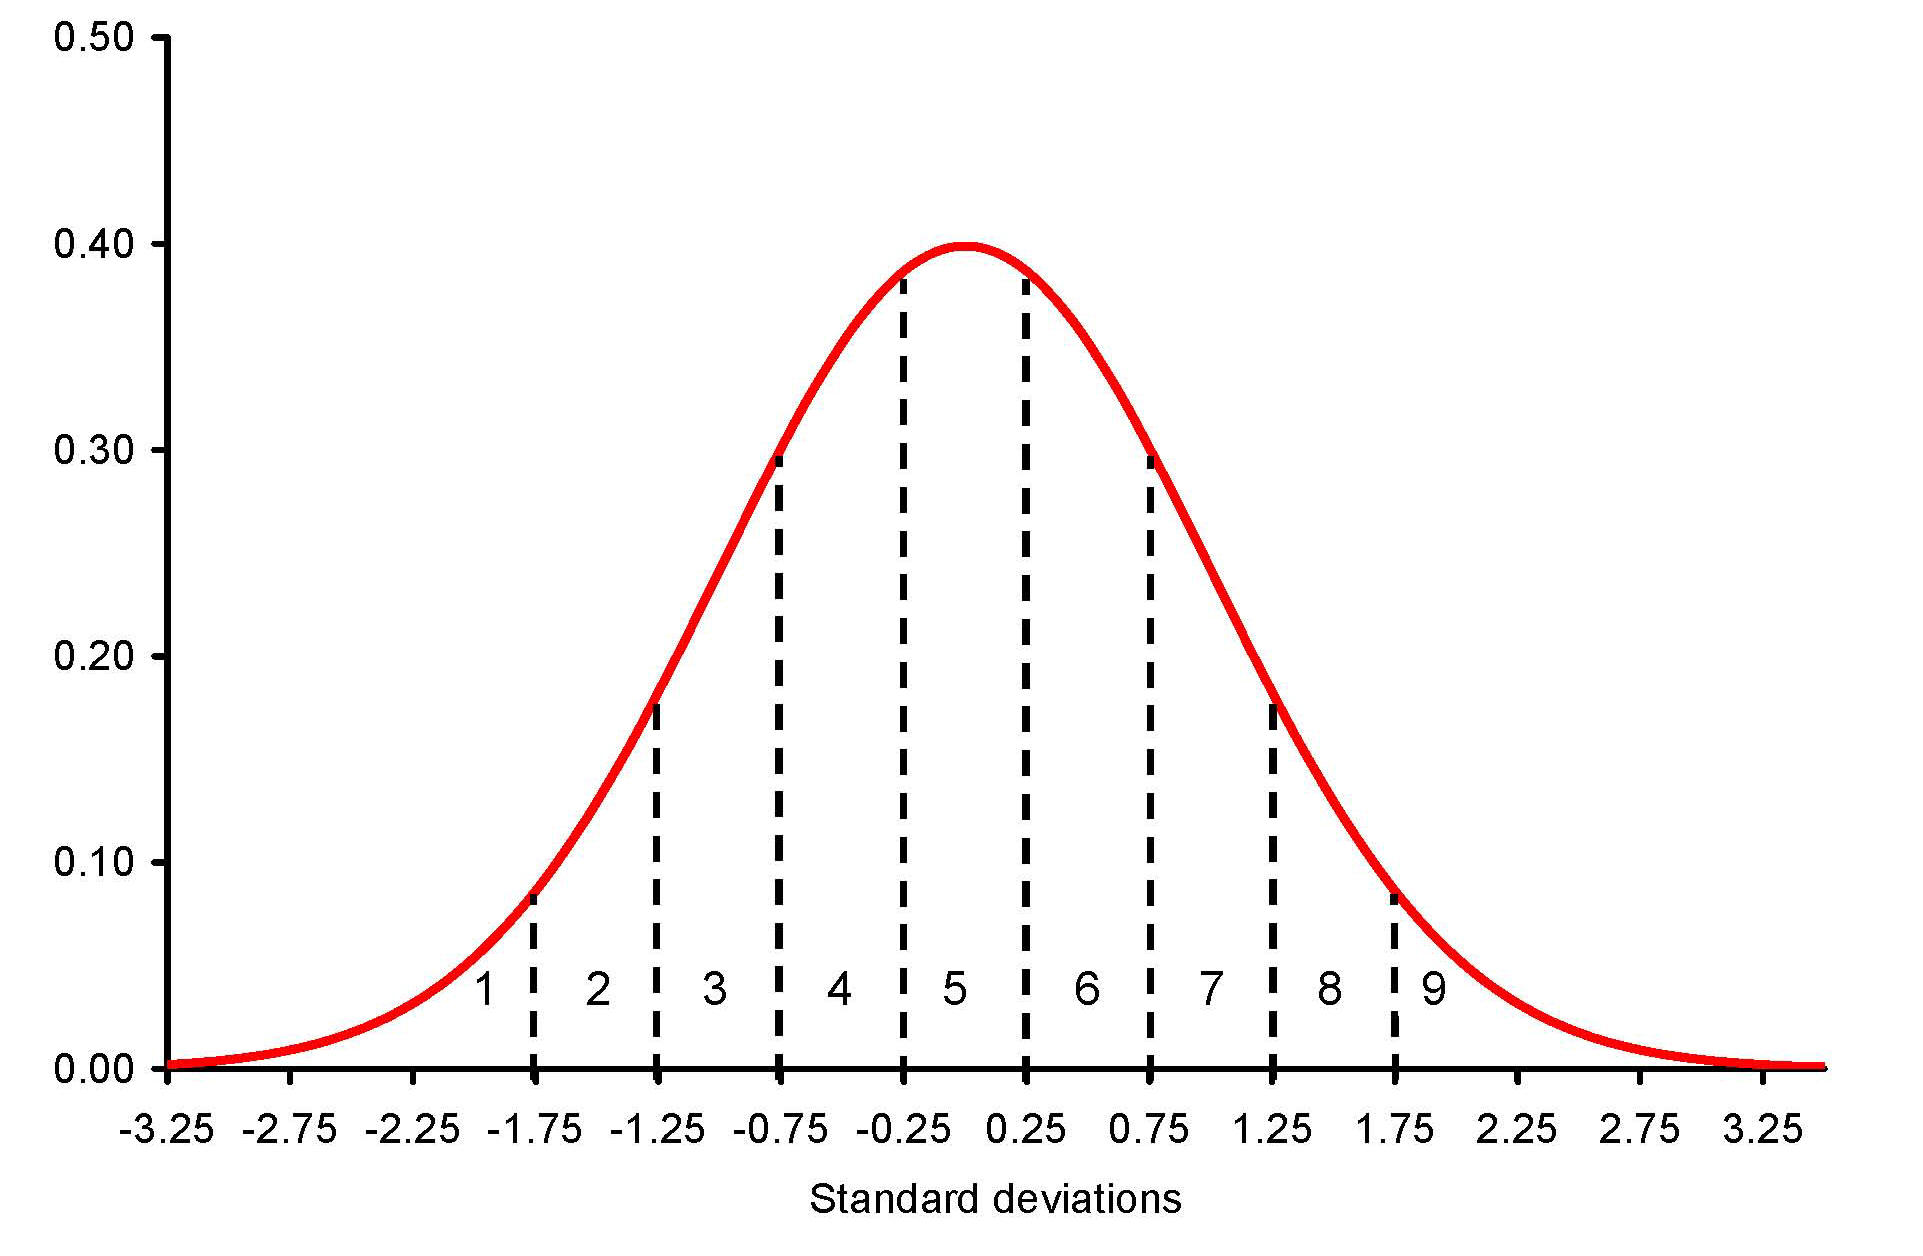
Stanines
n
Stanines (an abbreviation of STAndard NINE) are similar to quartiles and deciles in that each score
falls into a category instead of having a unique standardized value like Z scores and T scores.
n
To define the stanines, the distribution is divided into 9
categories. Each category is
0.5 SD wide (except the first stanine and the last [ninth] stanine, which are theoretically
infinite).
n
The 5th stanine (the middle one) extends from –0.25 Z
to +0.25 Z, thus straddling the mean, and the other stanines extend in 0.5 SD
increments from this middle interval, as seen in this figure (the dotted lines
show the borders of the numbered stanines):
n
Stanines are sometimes used to categorize performance on certain
tests, where a person’s exact score is not as important as identifying groups of
people with similar performance, particularly those above and below average.
 Click
to go to the next section (Section 5.2)
Click
to go to the next section (Section 5.2)