PEP 6305 Measurement in
Health & Physical Education
Topic 3:
Percentiles & Measures of Central Tendency
Section 3.1
n
This Topic has 2 Sections.
Readings
n
Vincent
& Weir, Statistics in Kinesiology 4th ed.,
Chapter 3:
“Percentiles” and Chapter 4: “Measures of
Central Tendency”
Purpose
n
To demonstrate the computation of percentiles for a distribution
of scores.
n
To discuss and demonstrate various measures of the central
tendency of a distribution of scores.
Percentiles
n
A percentile is a point on a scale where a certain
proportion of the
population lies at or below.
¨
Example: a score at
the 75th percentile means that 75% of the population have
scores at or below that value.
n
Percentiles are a type of standard score, which means that
a raw score is converted into a score that has a known (“standard”)
meaning.
¨
Usually the standard is a comparison to the
distribution of scores in a population (of subjects or
other objects being compared) or a comparison to a known range of values (as is
the case in laboratory measures).
n
In the case of percentiles, the known range is 0% to 100% and the
midpoint
(with half of the population above and half below) is 50%.
n
Percentiles can be used to determine where a person’s performance or rating lies in relation to the population.
Common Percentile
Divisions
n
Because measurement can never be perfect, ranges of scores and
ranges of percentiles
are often used to report test results.
¨
Since a person's score varies slightly from test to test, these
intervals often provide a more fair representation of a person’s abilities than
an exact percentile score.
¨
Two examples of these ranges of percentiles are
quartiles and deciles.
n
Quartiles (four divisions, ranges of 25 percentile units): quartile 1 = 0 to 25th
percentile (Q1), quartile 2 = top of Q1 to 50th percentile (Q2), quartile 3
= top of Q2 to 75th percentile (Q3), quartile 4 = top of Q3 to 100th
percentile. Each quartile contains one-fourth (25%) of the scores in the
distribution. See Figure 3.2 in the text.
n
Deciles (ten divisions, D1 to D10): similar to quartiles, but
progressing by ranges of 10 percentile units; decile 1 = 0 to 10th
percentile (D1); decile 2 = top of D1 to 20th percentile, etc. See
Figure 3.2 in the text.
n
Remember: a quartile or decile is a range of percentiles; a
specific percentile is equivalent to a single score (in standardized
form).
n
A quartile rank or decile rank means that the person’s score
lies within a certain quartile or decile.
¨
Example: someone with a decile rank of 9 means that their score
lies in the 9th decile—their score is between the 80th and
90th percentile.
Calculating
Percentiles

n
The ways to calculate percentiles vary depending on whether you
have all of the data or only have summaries such as a
simple frequency
distribution or a
grouped frequency distribution.
n
If you have all of the data, create a
rank order distribution.
Using the rank order distribution, for each score, figure out how many scores
fall at or below that score. Divide that number by the total number of
scores. Multiply by 100 and round to the nearest whole percent value. That
percent value is the percentile.
¨
Example: In Topic 2, you created a rank order distribution for
these data: 525, 505, 507, 654, 631, 281, 771, 575,
485, 626, 780, 626. What are the percentiles for each value in this
distribution? (Click to see an Excel file solution to
this problem.)
n
If you have only summaries of the data, use Equation 3.01
from the text:
where X is the score,
L is the lower real limit of the interval (see the text, p. 26), i is the
width of the
interval, f is the frequency in the interval, C is the
cumulative
frequency of the next lowest interval, and N is the total number of
subjects/cases.
¨
Example: for the grouped frequency distribution in Table 3.3 in
the text, the percentile for a softball throw of 195 feet is:
 ,
or approximately the 85th percentile.
,
or approximately the 85th percentile.
¨
For the score of 195 in this distribution,
X
= 195;
L
= 189.5;
i
= 10;
f
= 7;
C
= 94; and
N
= 115.
¨
What are the percentiles for softball throws of 200 feet, 175
feet, 150 feet, and 100 feet? (Click HERE for
answers.)
n
It is also possible to estimate a score for a given percentile
(if you have the
simple frequency distribution for the scores).
¨
Convert the percentile to
a decimal. For example, the decimal for a percentile of 75 is 0.75; for 50 is
0.50; and for 10 is 0.10.
¨
Multiply that decimal value by the number of scores in the set of data being
analyzed. For example, if you want the 50th percentile for 40 scores: 0.50
× 40 =
20.
¨
Count that number of scores in a simple frequency distribution, starting from
the bottom (lowest/worst score) up to that number of scores.
¨
For the example, count from the lowest score to the 20th score.
That score (in this case, 20th from the bottom) is the raw score
for the respective percentile.
¨
If the number of scores to count is not an integer,
round up
to the next whole number and use that score. For example, if you want the 23rd
percentile for 40 scores: 0.23
×
40 =
9.2.
In this case you count to the
10th
score from the bottom, and that is your raw score for the 23rd percentile.
n
Click
here to see solutions worked
in Excel to Chapter 3 Problems 1 and 2 (compute percentiles from scores and vice-versa).
(Please work them yourself, then check your work against
this key.)
n
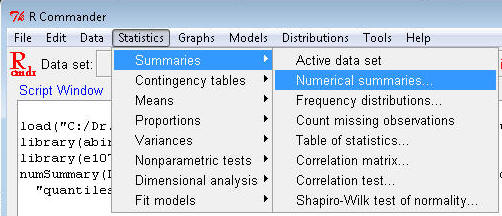
To obtain decile values in R
Commander, load your data file and go to the Statistics menu,
Summaries>Numerical summaries...
¨
In the dialog box, click
to highlight age to the Variables box and enter the numbers 0, .1, .2, .3, .4,
.5, .6, .7, .8, .9, 1 in the 'quantiles" box.
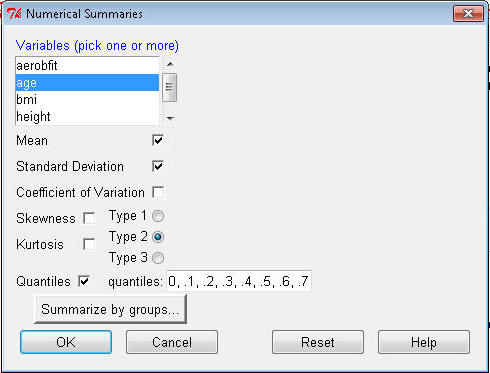
¨
Click OK. A table showing the decile
values for age appears in the Output window:
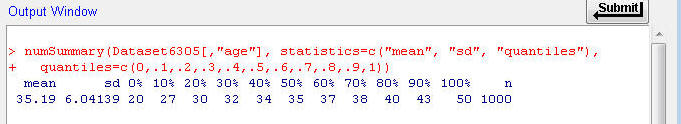
¨
The 20th percentile for age is 30 years, and the 70th percentile is 38, for
example.
¨
Note that the "0%" value is the minimum value in the data, and the "100%" value
is the maximum value. You'll use those in the next Topic to compute a value
called the range.
 Click
to go to the next section (Section 3.2)
Click
to go to the next section (Section 3.2)