PEP 6305 Measurement in
Health & Physical Education
Topic 2:
Organizing Data
Section
2.3
 Click to go to
back to the previous section (Section 2.2)
Click to go to
back to the previous section (Section 2.2)
The Normal
Distribution
n
We are going to discuss the normal distribution in
Topic 5.
The normal distribution is very important in statistics. For now, we'll just have a
brief overview.
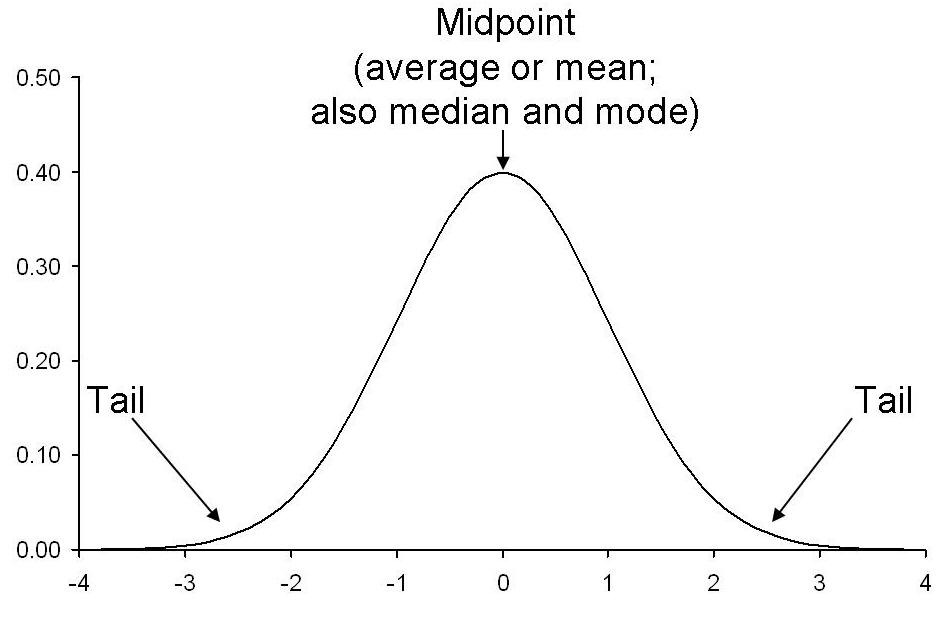
n
The normal distribution is symmetrically distributed on either
side of its midpoint, which is the average value (and also the median and mode;
we’ll get to that in
Topic 3 and
Topic 4).
n
The areas on either side of the peak are
called tails.
n
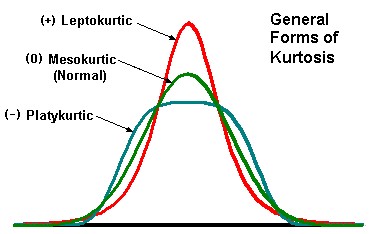
If the curve drawn from a distribution is asymmetric, then the
distribution is not normal. There are
several types of asymmetry: modality, peakedness (kurtosis), and spread
(skewedness).
¨
If the curve has more than one peak, it is multimodal (two
peaks = bimodal).
¨
If the curve is "too peaked" to be normal, it is
leptokurtic (lepto is Greek for thin or small; kurtos is
Greek for bulge; thus, "thin bulge").
¨
If it is "too flat," it is platykurtic (platy
is Greek for flat; thus, "flat bulge," like a platypus’s front feet
[platypus means "flat foot"] -- as well as its apparent beak!).
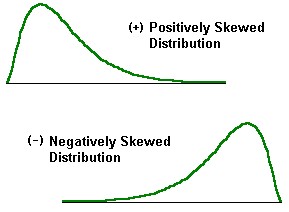
¨
If the curve has one tail that is longer than the other, it is
skewed. If the longer tail is on the left, it is negatively skewed
(too many scores toward the negative end). If the longer tail is
on the right, it is positively skewed.
n
The normal distribution is used in statistical analyses as an
approximation of the distribution of many common variables. The variables
are assumed to be normally distributed.
¨
If the variable is not "normally distributed," then using the normal
distribution as an approximation may result in errors.
n
There are many other types of statistical distributions that have
a variety of curve shapes (t, which looks similar to the normal;
chi square; and F, which
looks similar to chi square; are a few common
distributions). A central problem in statistics is identifying which
distribution best describes the distribution of a
statistic
(an estimate of the true value that is computed from a sample).
n
Statistical distributions are used in statistical analyses to
determine the probability of the observed data under certain conditions.
¨
Recall (or go back and review)
the discussion of hypothesis testing in Topic 1.
¨
Statistical analysis determines the probability of the data
occurring if the null hypothesis is true.
¨
The probability of the data occurring can be found using the normal
distribution (or whatever distribution is appropriate for the situtation). We’ll see how in
Topic 5.
Formative
Evaluation
n
Work problems 1 through 5 at the end of Chapter 2. Use R Commander
for the functions described in these notes.
¨
You can also use Excel, but make sure you know how to use
R Commander to
solve these problems; you will use R Commander on the exams.
¨
To
enter data in R Commander, click on Data>New data set...
You have reached the end of Topic 2.
Make sure to work through the Formative Evaluation
above and the textbook problems (end of the chapter).
You must complete the review quiz (in the Quizzes
folder on the Blackboard course home page) before you can advance to the next topic.