PEP 6305 Measurement in
Health & Physical Education
Topic 1: Science,
Measurement, & Statistics
Section 1.2
 Click to go to
back to the previous section (Section 1.1)
Click to go to
back to the previous section (Section 1.1)
Variables and
Constants
n
A variable
is a characteristic or property of the object of measurement that can take on
any value within a certain range of values. The range of values may be limited
or infinite.
¨
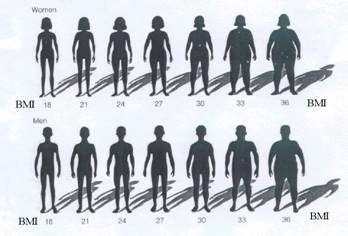
Example: Body weight is a variable. The body weight of UH students varies from person
to person; not all students have the same weight. There is a range of possible
values for body weight of UH students.
n
A constant
is a characteristic or property that can have only one value.
¨
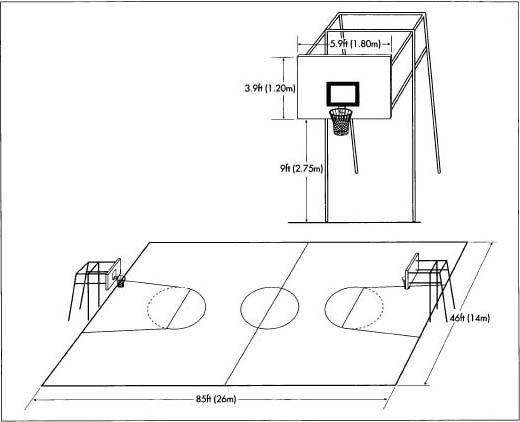
Example: Height of a basketball goal is a constant. The official height of a basketball goal is 10 feet, regardless
of which basketball court we're on. If we are comparing courts, the height of
the basket is always the same, so it wouldn't make sense to compare them based
on basket height. In fact, all dimensions of an official court are
constants--they are the same regardless of the arena in which the course is
located.
n
In general, we are interested in measuring and evaluating variables; constants do
not need to be measured or evaluated (constants always have the same value, so
what is there to measure?).
n
So, what good are constants? We may set up a study so that certain conditions or
characteristics are constants for all subjects. If those conditions and
characteristics are the same for everybody in the study, then those things
cannot influence the results of the study. We can then focus on how the
variables in the study (the things that are not the same for everybody) affect
one another. (We'll discuss research design in more detail
below.)
n
Which of the following are
variables
and which are
constants?
¨
100 m dash times for the UH women's track team
¨
Caloric intake of UH freshman
¨
Amount each UH student pays for textbooks
¨
In-state tution to enroll in 9 hours of graduate courses
¨
Gender of football players at UH
¨
One repetition maximum leg press weight
¨
Number of bases on a softball diamond
¨
Answers
 n
Continuous variables can assume any value from of a
theoretically infinite range of values, including integers (whole numbers) and decimal values.
Time, mass, length, and force are continuous variables.
n
Continuous variables can assume any value from of a
theoretically infinite range of values, including integers (whole numbers) and decimal values.
Time, mass, length, and force are continuous variables.
¨
Examples: 4.23 seconds, 10.22587 kg, 110.79 meters, and 2.2255 Newtons all
have precise meanings.
n
Discrete variables can only assume integer values.
Variables that are measured as counts (such as heartbeats, calories, number of repetitions, number of golf strokes, etc.) and categories (such
as male and female, carbohydrate and protein, apples and pears, aerobic and
anaerobic exercise, driving and putting, etc.) are discrete variables.
of repetitions, number of golf strokes, etc.) and categories (such
as male and female, carbohydrate and protein, apples and pears, aerobic and
anaerobic exercise, driving and putting, etc.) are discrete variables.
¨
Examples: In contrast to continuous variables, a heart rate of 65.3 beats
per minute, 4.3 calories, 8.67 repetitions, a golf score of 75.6, "malefemale,"
and "carboprotein" as a food group do not have precise meanings--these discrete
variables do not exist in parts, so using decimals does not make sense.
Types of Data Scales
n
Data can also be categorized by the type of
scale upon which it
is measured.
n
The scale affects the way in which data
values and statistics using those data values are interpreted. It does
not change the way that the data values can be analyzed statistically
(although some of those statistical analyses would make no sense when you try to
interpret them).
n
There are
four scale types:
nominal, ordinal, interval, and ratio.
n
A nominal scale uses categories that have no particular
order. The units of a nominal scale are categories that do not overlap; an
object cannot be in more than one category. Automobile make (Ford, Chevy, Honda, Toyota, etc.),
teams (Cougars, Owls, Tigers, etc.), and gender (female, male) are nominal scale
variables.
n
An ordinal scale uses categories that have a particular
order. The units of an ordinal scale are categories that do not overlap and
defined such that a higher category has more of some property and characteristic
than the preceding category. Class year (freshman, sophomore, junior, senior),
game innings or quarters (1st, 2nd, 3rd, etc.), and meal (breakfast, brunch,
lunch, hors d'oeuvres, salad, soup, meat, dessert, etc.) are ordinal
scale variables.
Note:
Nominal and ordinal scales involve discrete variables.
n
An interval scale has a unit of measurement that is equal
across the whole range of possible values (the units also do not overlap and
relate an order to the property being measured). An interval scale has no "true zero"
value: the value of zero does not imply an absence of the
characteristic; zero is simply another number used to describe a position on the
scale. An interval variable can assume negative values.
¨
Temperature
in
degrees Fahrenheit or Celsius are examples of interval scales. The unit (degree)
means the same thing on all parts of the scale. A value of zero does not mean an
absence of temperature but is just another value (in Celsius, it is the freezing
point of water), and negative values are possible and meaningful.
n
A ratio scale also has a consistent unit of measurement,
but has a true zero value that implies an absence of the characteristic (the
units also do not overlap and relate an order to the property being measured).
¨
Mass, length, energy, and many laboratory values are measured on
ratio scales. For example, the unit of energy (calories) means the same thing on
all parts of the scale. A value of zero calories means an absence of energy.
Negative values don't make any sense, unless you change the definition of the
measure (such as saying that negative calories indicates an energy deficit
rather than energy).
Note:
Interval and ratio scales involve continuous variables.
n
As an example of how scale affects interpretation, only measurements made using ratio scales can be used for
proportional comparisons between objects, such as “twice as much” or “half as
much.” This interpretation does not work for interval, ordinal, or nominal scale
variables.
¨
An object with a mass of 10 kg (mass is a ratio scale) has
twice the mass of an object of 5 kg, but a temperature
of 50 degrees Fahrenheit (degrees Fahrenheit is an interval scale) is not half as hot as a temperature of 100
degrees Fahrenheit.
¨
A sophomore (ordinal scale) does not necessarily have twice as
much knowledge (or semester hours) as a freshman, although sophomores do (we
hope) have more knowledge (and semester hours) than freshman. Similarly,
the
difference in knowledge between a sophomore and junior is not the same as the
difference in knowledge between a junior and senior, even though both are
separated by a single academic year.
¨
A Ford (nominal scale) is not twice or half of a Chevy—and vice
versa. The "difference" between a Ford and a Chevy is not the same as the difference
between a Ford and a Honda.
n
If you need more
information about scale types click
here (PDF); this handout is optional,
but gives a more detailed explanation.
n
Research design is a plan for collecting data
so that the statistical analysis can be used to answer a specific
research question.
¨
Collecting data without the right plan provides no answer
at all!
n
Several types of research exist.
¨
Historical research uses information from the past
to attempt to better understand the present.
n
For example, we can study the development of how women became
involved in organized sports in the early and mid 20th century to better
understand the role of sports in women's lives today.
n
Historical research will not be addressed in this course, but our
department and college have faculty who use
historical research methods.
¨
Descriptive research involves describing current
events and conditions in order to better understand them.
n
For example, we may collect data regarding a particular program or
facility; by analyzing that data, we can get a good idea of how the program or
facility are functioning and identify potential areas for improvement.
n
Many of the statistical techniques we'll discuss can be used in
descriptive research.
¨
Experimental research involves the design and
conduct of experiments, is what we will focus on.
n
Experiments involve the manipulation and control
of conditions and variables to answer a question.
n
Experiments can also identify what causes certain effects
or reactions, which is one of the most important goals of science.
n
For example, we may randomly assign subjects to one of two different nutritional
interventions, then measure their body weight or other health indicators over
time. Assume we also have all of the subjects participate in the same
exercise program. By comparing the groups at the various time points, we can
determine whether one intervention is more beneficial than the other.
n
In this example, nutrition is a variable that is manipulated because the
investigator determines which subjects get which intervention. Activity
level (exercise) is a constant and is controlled; all subjects do the
same exercise regardless of which nutritional intervention group they are in.
n
To design a study:
¨
Identify and define a problem that is worth solving;
¨
Investigate what is already known about the problem, and form a
specific question to be answered (something not already known);
¨
Using that information, form a reasonable potential answer to the
question—this potential answer is called a hypothesis;
¨
Set up the conditions under which you will measure the variable of
interest so that you can test the potential answer.
n
The potential answer is called the research hypothesis.
¨
The research hypothesis, however, is not the
hypothesis that is tested in statistics.
n
Statistics test the null hypothesis.
¨
The null hypothesis is how the data will turn out if your
potential answer (your research hypothesis) is wrong.
n
Statistical analysis compares the observed data
(results) to what is expected assuming that the null hypothesis is true; the analysis provides a probability that the data match
what is predicted by the null hypothesis.
¨
If the probability is small, such as than 1 in 20 (5%, or 0.05),
that data match what is predicted by the null hypothesis, then the null
hypothesis is rejected because it is unlikely to be correct;
this provides support for you research hypothesis.
¨
If the probability that data match what is predicted by the null
hypothesis is large (higher than 5%), then the null hypothesis is not rejected because we have no
evidence that it is incorrect. The research hypothesis is not supported—and
we conclude that your potential answer is probably wrong. (Note: the null
hypothesis is not “accepted,” because we have no evidence that it is
actually correct—we only have insufficient evidence to conclude that it is
wrong. Thus, we “fail to reject the null hypothesis,” we do not “accept” or
“prove” the null hypothesis. Confused?)
¨
All of this depends on correctly setting up the experimental
conditions to provide data that support the research hypothesis if it
is true; then the statistical test will indicate that the null
hypothesis is unlikely to be true. If the set up is bad, the resulting data will
not provide a good test.
n
The researcher determines (before doing the study) how
much confidence to have in the decision to reject the null hypothesis.
¨
A widely accepted standard is a probability
≤0.05 (1 in 20, or 5 in 100) provides sufficient evidence that the null
hypothesis can be rejected.
¨
This means that if the exact same study was repeated 100 times,
the results you obtained would occur in 5 (or fewer) of those studies if the null
hypothesis was actually true. This means that the decision to reject the
null hypothesis will be wrong up to 5% of the time.
¨
You would thus have 95% confidence (100% - 5% = 95%) that
you were right to reject the null hypothesis in favor of your hypothesis.
n
We discuss in later Topics how various statistical analyses
provide tests for
different types of hypotheses.
Independent and
Dependent Variables
n
An independent variable is one
that is free from influence of other variables—its value is independent
of other variables’ values.
n
A dependent variable is not free from the influence of
other variables—its value depends on the value of other variables.
n
In experiments, the investigator manipulates one or more independent variables
in order to discover how they change the dependent variable.
n
For example, you manipulate diet by randomly assigning
subjects to one of two different diets to discover the effect on weight loss. By
comparing the body weights of the two groups after some period of time, you can
determine if one diet results in more weight loss than the other.
¨
In this example, what is the
independent variable? What is the
dependent variable?
n
Read
this Web page to learn more about independent and dependent variables.
This distinction becomes important when doing statistical analyses, so it is
important that you have the idea clear in your mind before continuing.
Formative
Evaluation
n
What is a variable? What is the difference between a continuous
variable and a discrete variable?
n
Give two examples each of nominal, ordinal, interval, and ratio
scale variables in health or kinesiology. Make sure you can justify why your
variables fit the particular scale to which you’ve assigned them.
n
What are some of the types of research? What distinguishes
experimental research from descriptive research?
n
Design an study using the steps outlined in the notes above.
n
In your study, what is (are) the independent variable(s) and
what is the dependent variable?
n
What is the difference between the research hypothesis and the
null hypothesis? How do you know if the null hypothesis is unlikely to be true?
Click to go to the
next section (Section 1.3)