

|
|
Pull-ups |
|
|
18 |
|
|
17 |
|
|
16 |
|
|
15 |
|
|
14 |
|
|
13 |
|
|
12 |
|
|
12 |
|
|
10 |
|
|
9 |
|
|
9 |
|
|
8 |
|
|
8 |
|
|
5 |
|
|
2 |
|
|
|

|
|
Pull-ups |
f |
|
|
20 |
2 |
|
|
19 |
0 |
|
|
18 |
3 |
|
|
17 |
6 |
|
|
16 |
8 |
|
|
15 |
10 |
|
|
14 |
17 |
|
|
13 |
21 |
|
|
12 |
25 |
|
|
11 |
24 |
|
|
10 |
26 |
|
|
9 |
19 |
|
|
8 |
16 |
|
|
7 |
12 |
|
|
6 |
10 |
|
|
5 |
4 |
|
|
4 |
3 |
|
|
3 |
2 |
|
|
2 |
1 |
|
|
1 |
2 |
|
|
0 |
1 |
|
|
|
∑ = 212 |


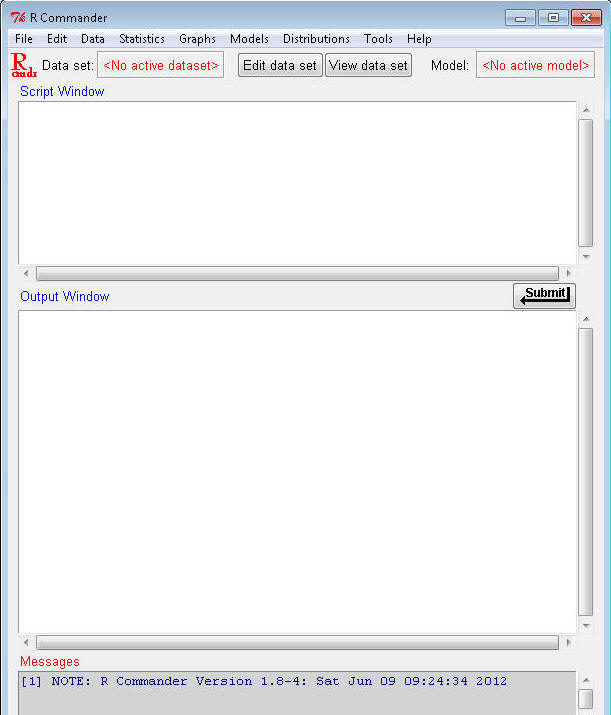
The R Commander allows you to use "point and click" menus as well as entering program language commands in the Script Window box (without R Commander, everything would have to be entered as program commands).
To do statistical analyses, you need data. To follow along with the examples in these notes, download the 'Dataset6305' data file from Blackboard, or right-click and "Save target as..." to download and save 'Dataset6305.RData'. Save it somewhere on your computer that is easy to find, you'll need it for the next few course Topics. This data file is already formatted for use with R (which is why it's file extension is '.RData'). It contains data on several variables for 1000 fictional people - I made the data up, but the relations among the variables are based on relations you might observe in the "real world."
Now you need to show R Commander where the data are. R calls this "loading" the data set. In the R Commander window, click to go to the Data>Load data set... submenu:
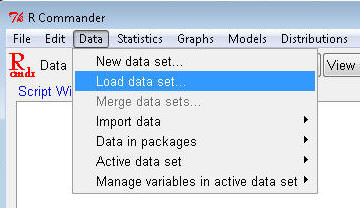
Navigate to the Dataset6305 file location on your computer and click "Open". In both the Script and Output windows you should see a message similar to this, depending on your particular file path:
> load("C:/Documents/Courses/PEP 6305 Measurement/Dataset6305.RData")
You will follow these steps each time you open R Commander and load a data file in this course. (You can see your data by clicking the View data set button near the top of the R Commander window.) You can quit/exit R Commander and R using the "File>Exit...both R Commander and R" menu selection in R Commander. It will ask if you want to savel the "Script", which is the commands used to do the analysis, or save the Output, which you'll need to do for some of the exams. The output is saved as a text file that can be read by any word processing program.
Now, finally, back to the analysis! You'll evaluate the simple frequency distribution of the variable age in Dataset6305. This analysis will show you how many people of each age are in the sample.
Click in the the Script Window and type table(Dataset6305$age) (what does this mean?) or highlight and copy this text and paste it in. Then, with the cursor still on the same line, click on the Submit button (just below and to the right of the Script Window). The Output Window shows the following:

This shows you the frequency (bottom row) of each age (top row, ages 20 through 50 years); for example, there are 85 people age 34, 40 people age 42, and so on. This frequency distribution is horizontal rather than vertical, but shows you the same information.

|
|
X |
f |
|
|
580-599 |
3 |
|
|
560-579 |
9 |
|
|
540-559 |
13 |
|
|
520-539 |
15 |
|
|
500-519 |
17 |
|
|
480-499 |
21 |
|
|
460-479 |
19 |
|
|
440-459 |
25 |
|
|
420-439 |
23 |
|
|
400-419 |
18 |
|
|
380-399 |
15 |
|
|
360-379 |
12 |
|
|
340-359 |
9 |
|
|
320-339 |
5 |
|
|
300-319 |
2 |
|
|
|
∑ = 206 |

This output shows the number of people with age values in each of the respective 12 bins. The values included in each bin can be read in the top row. The paranthesis and square bracket notation tells you where the breaks are. The paranthesis mark indicates that the bin's boundary is at the value, but does not include the value. The square bracket indicates the bin's boundary includes the value. The first bin starts at 20 and goes up to and including 22.5. The second bin starts at just above 22.5, but does not include 22.5, and goes up to and including 25. And so on. (The first interval actually starts just below 20 so it includes 20, but that "just below" value is not shown in the R output.)
You can save the Output window as a text file by File>Save output as...
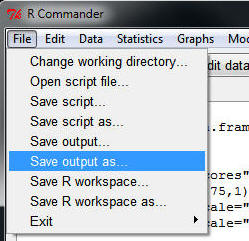
You'll see the typical 'Save' dialog box, and you can navigate to the folder on your computer where you want to save it, and name it whatever you want.
THIS IS IMPORTANT: You will be asked to turn in the saved output file from your analyses for the exams.
![]() Click to go to the
next section (Section 2.2)
Click to go to the
next section (Section 2.2)